Quickstart
This quickstart guide assumes you have already performed photometry using one of the supported pipelines (see Introduction), and have already configured phot2lc to run properly on your machine.
Basic Usage
phot2lc is a command line tool, and can be executed from the command line by simply typing
phot2lc
phot2lc also has several command line arguments available:
-h --help       Show command line options
-c --codes      Print list of available telescope codes
-b --barycorr   If used, skip barycentric corrections
-n --nolog      If used, ignore existing phot2lc_log file
-a --author     Name of phot2lc user
-t --telescope  Code name for telescope used
-s --source     Code name for photometry pipeline used
-p --photname   Base filename for photometry input files
-i --image      Name of specific image instead of an image list
-o --object     Name of object matching stars.dat entry
-f --filter     Name of filter used for observations
When the --author, --telescope, --source, --photname, --image, --object, or --filter options are used, they will override the defaults that are set within the config.dat file by the photconfig program.
Input Files
For ccd_hsp output, phot2lc will assume the photometry files have base names of runbase followed by the aperture size (e.g. runbase2.5), while for MAESTRO output the photometry files are assumed to have base names of counts, again followed by the aperture size (e.g. counts_02.5).
In addition, the following files/info should be present:
stars.dat (for RA and Dec coordinates)
The first FITS image (or all images within image_list_name)
If available, the file pointed to by pixloc_name
An entry within teledat.py corresponding to your telescope/instrument
If you need to add a new entry into teledat.py for your telescope/instrument, you can do this yourself by manually editing the teledat.py file. The format for teledat.py entries is explained within the script itself. Alternatively, you can send a request to Zach Vanderbosch to add your telescope configuration into the official phot2lc package.
Startup
Once you have started phot2lc and it successfully loads all the necessary files, the following three windows will appear (click to enlarge):
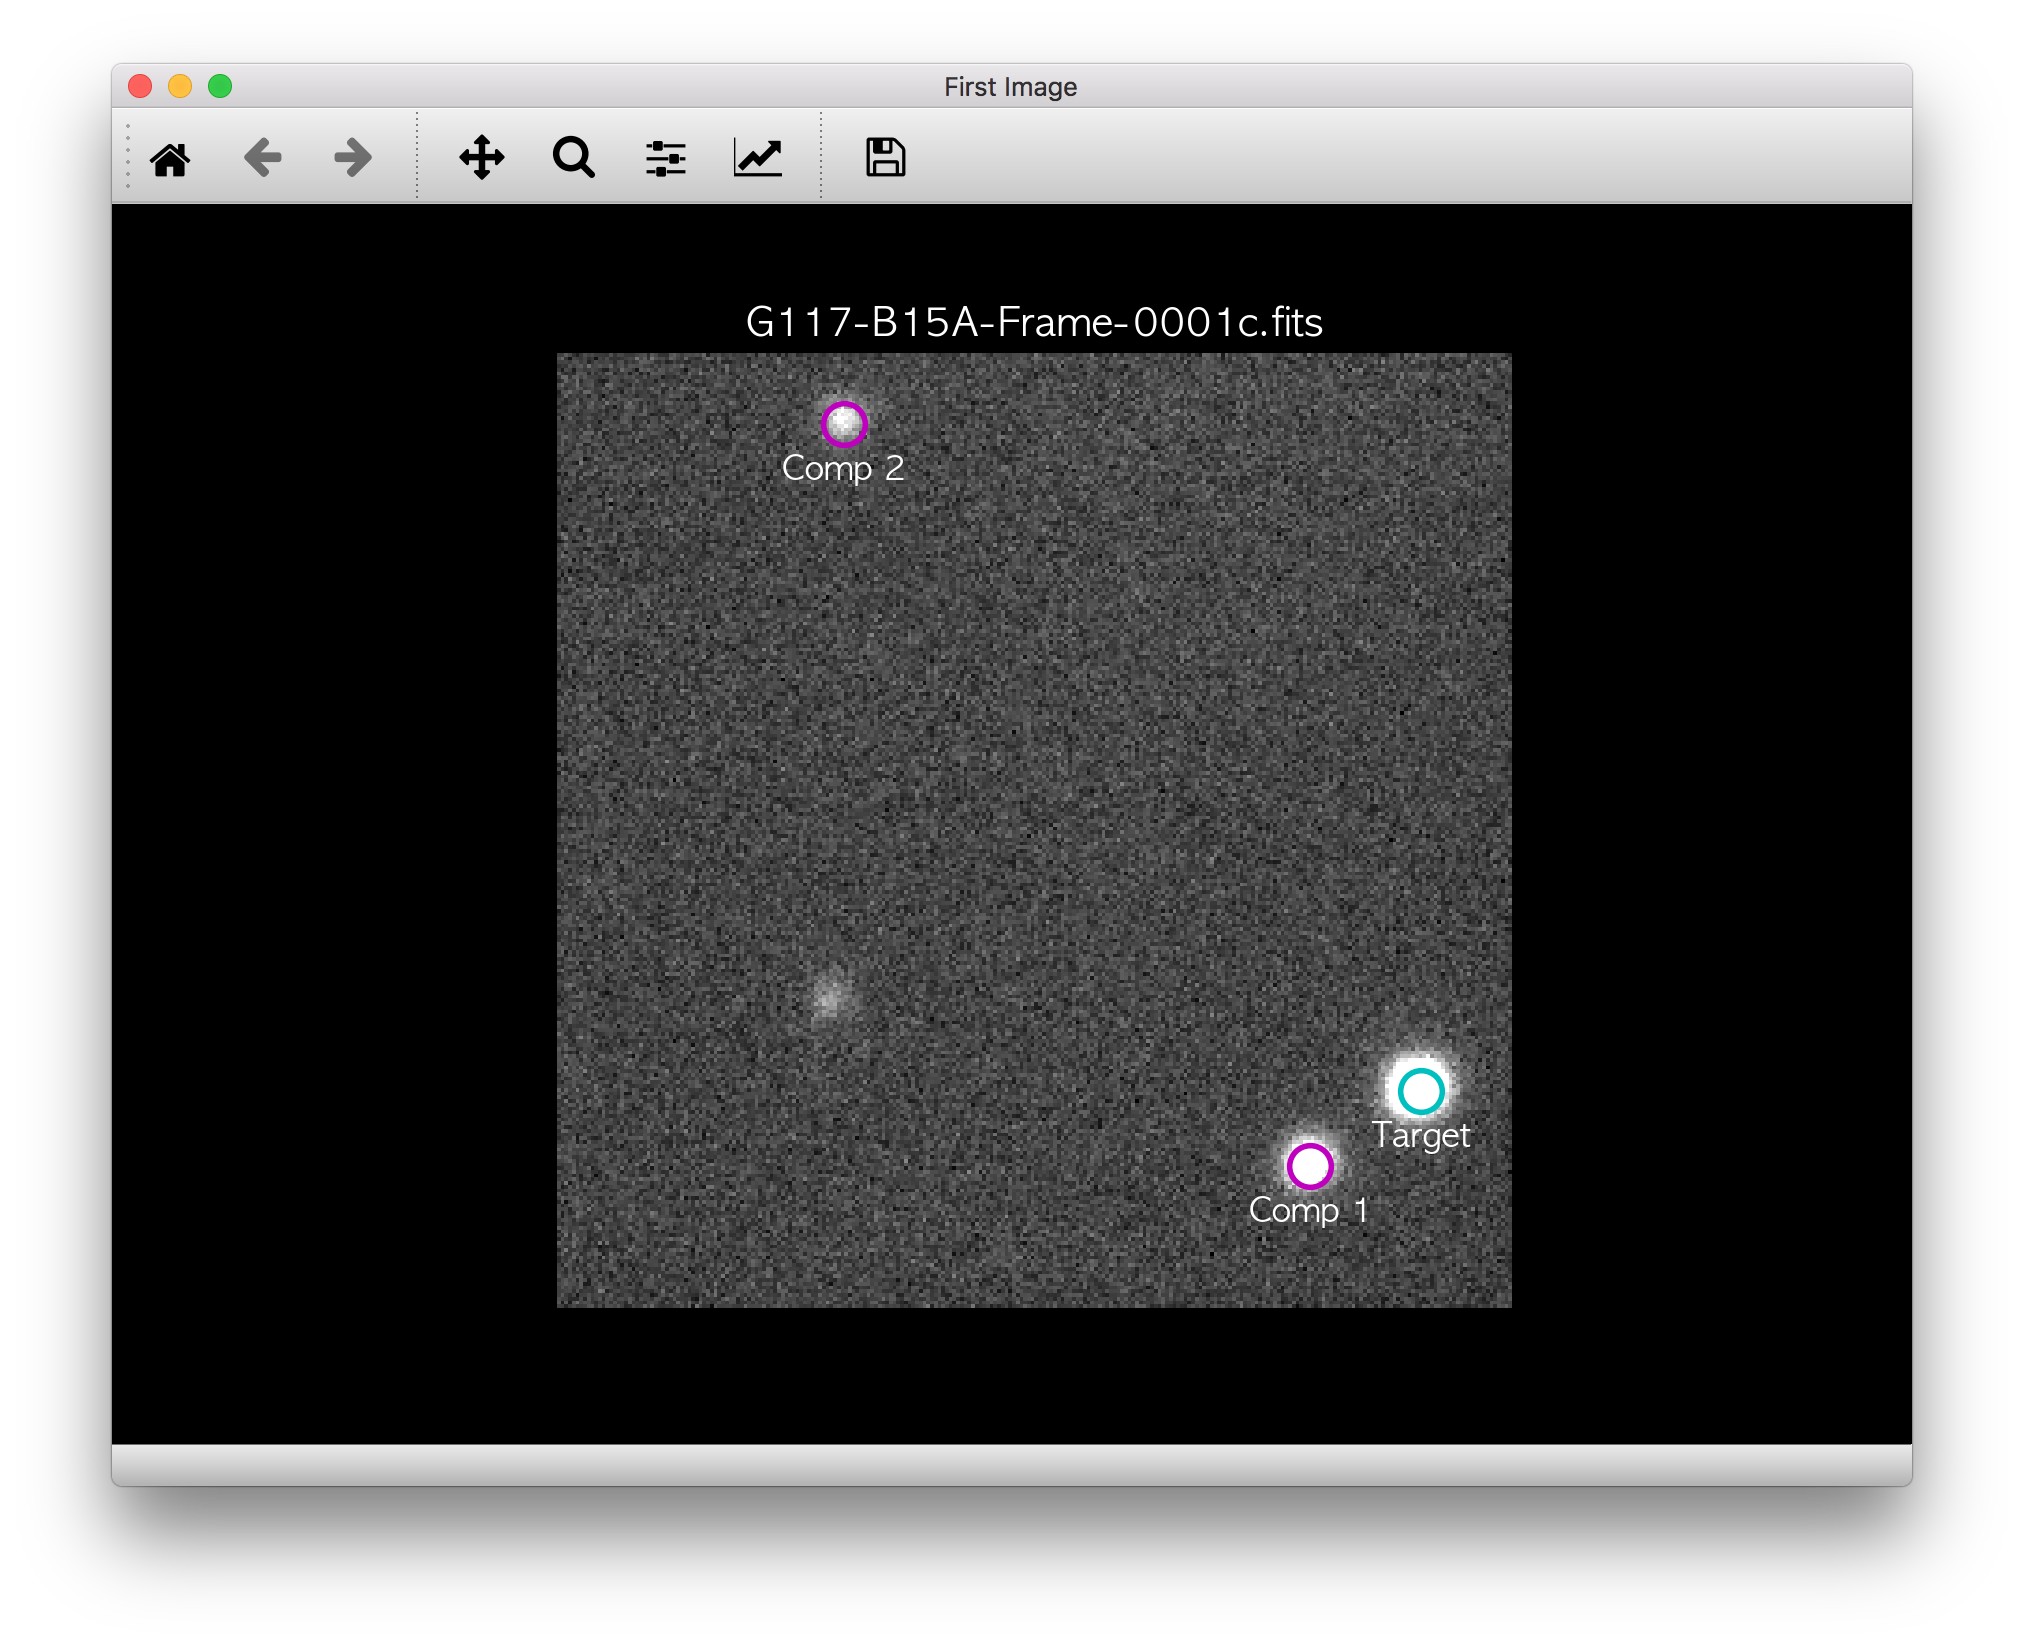
From left to right, these windows are named:
First Image: Displays the first image. The target and comparison stars are marked if a pixloc_name file was provided, otherwise this will just be an unmarked image. This image will be saved as a PNG file when the program is run.
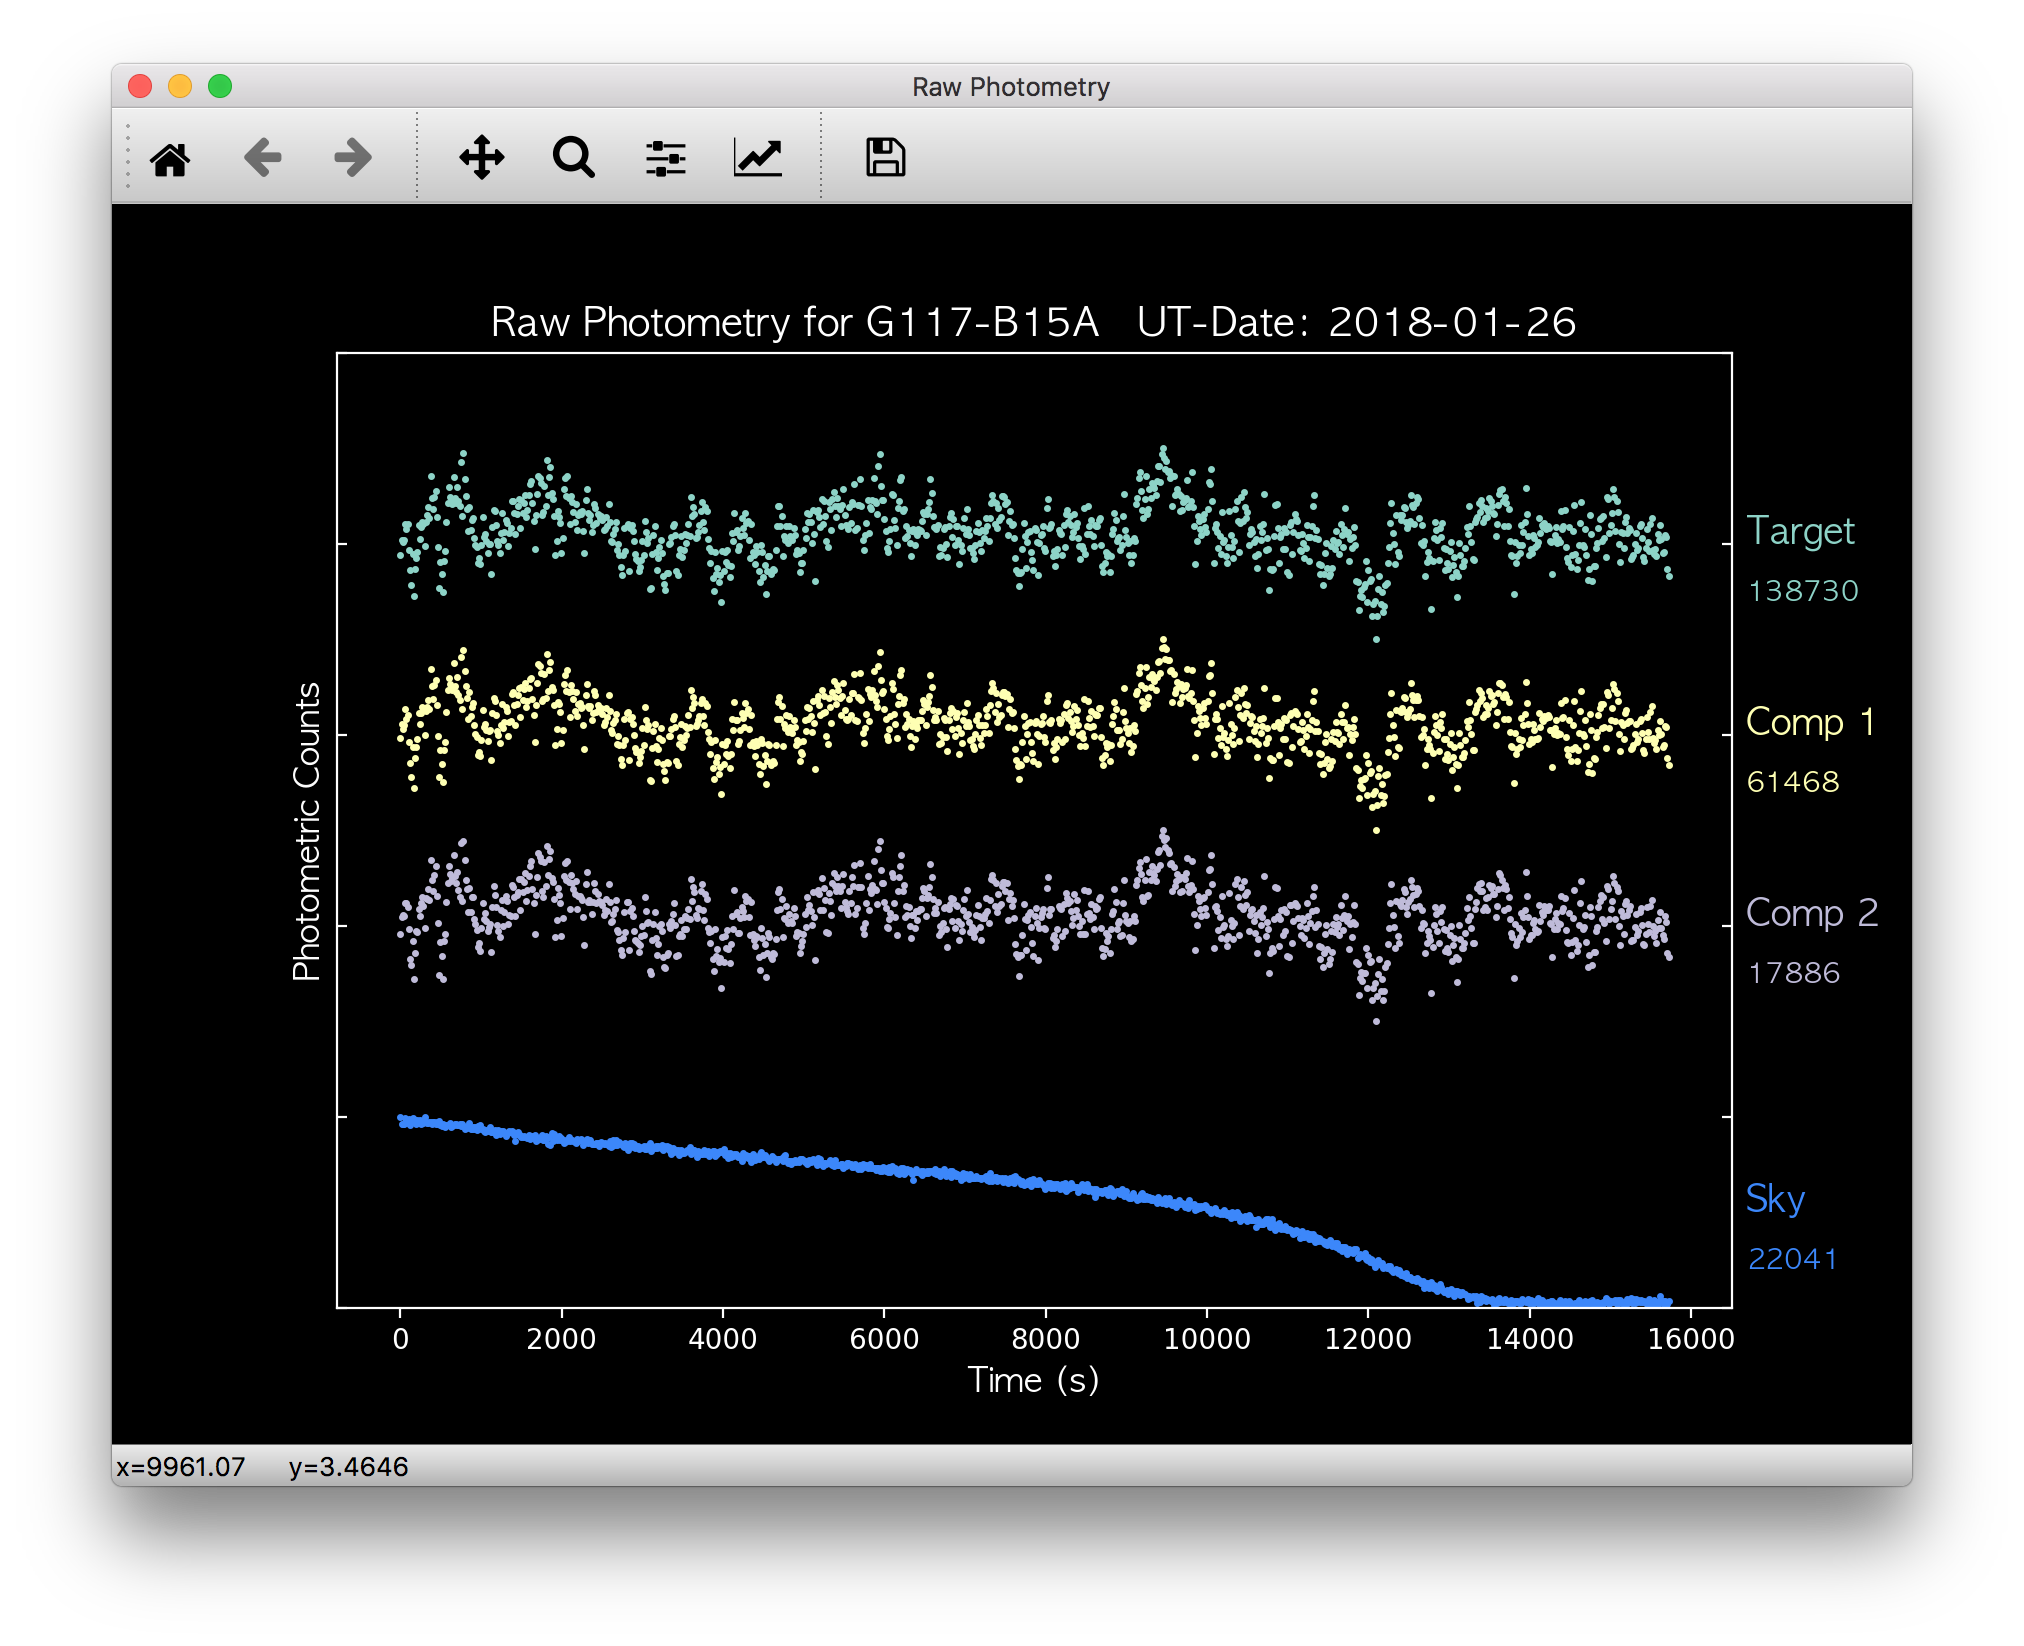
Raw Photometry: Displays the raw photometry for target and comparison stars, along with the amount of sky subtracted from the target. The mean values are displayed to the right of each light curve.
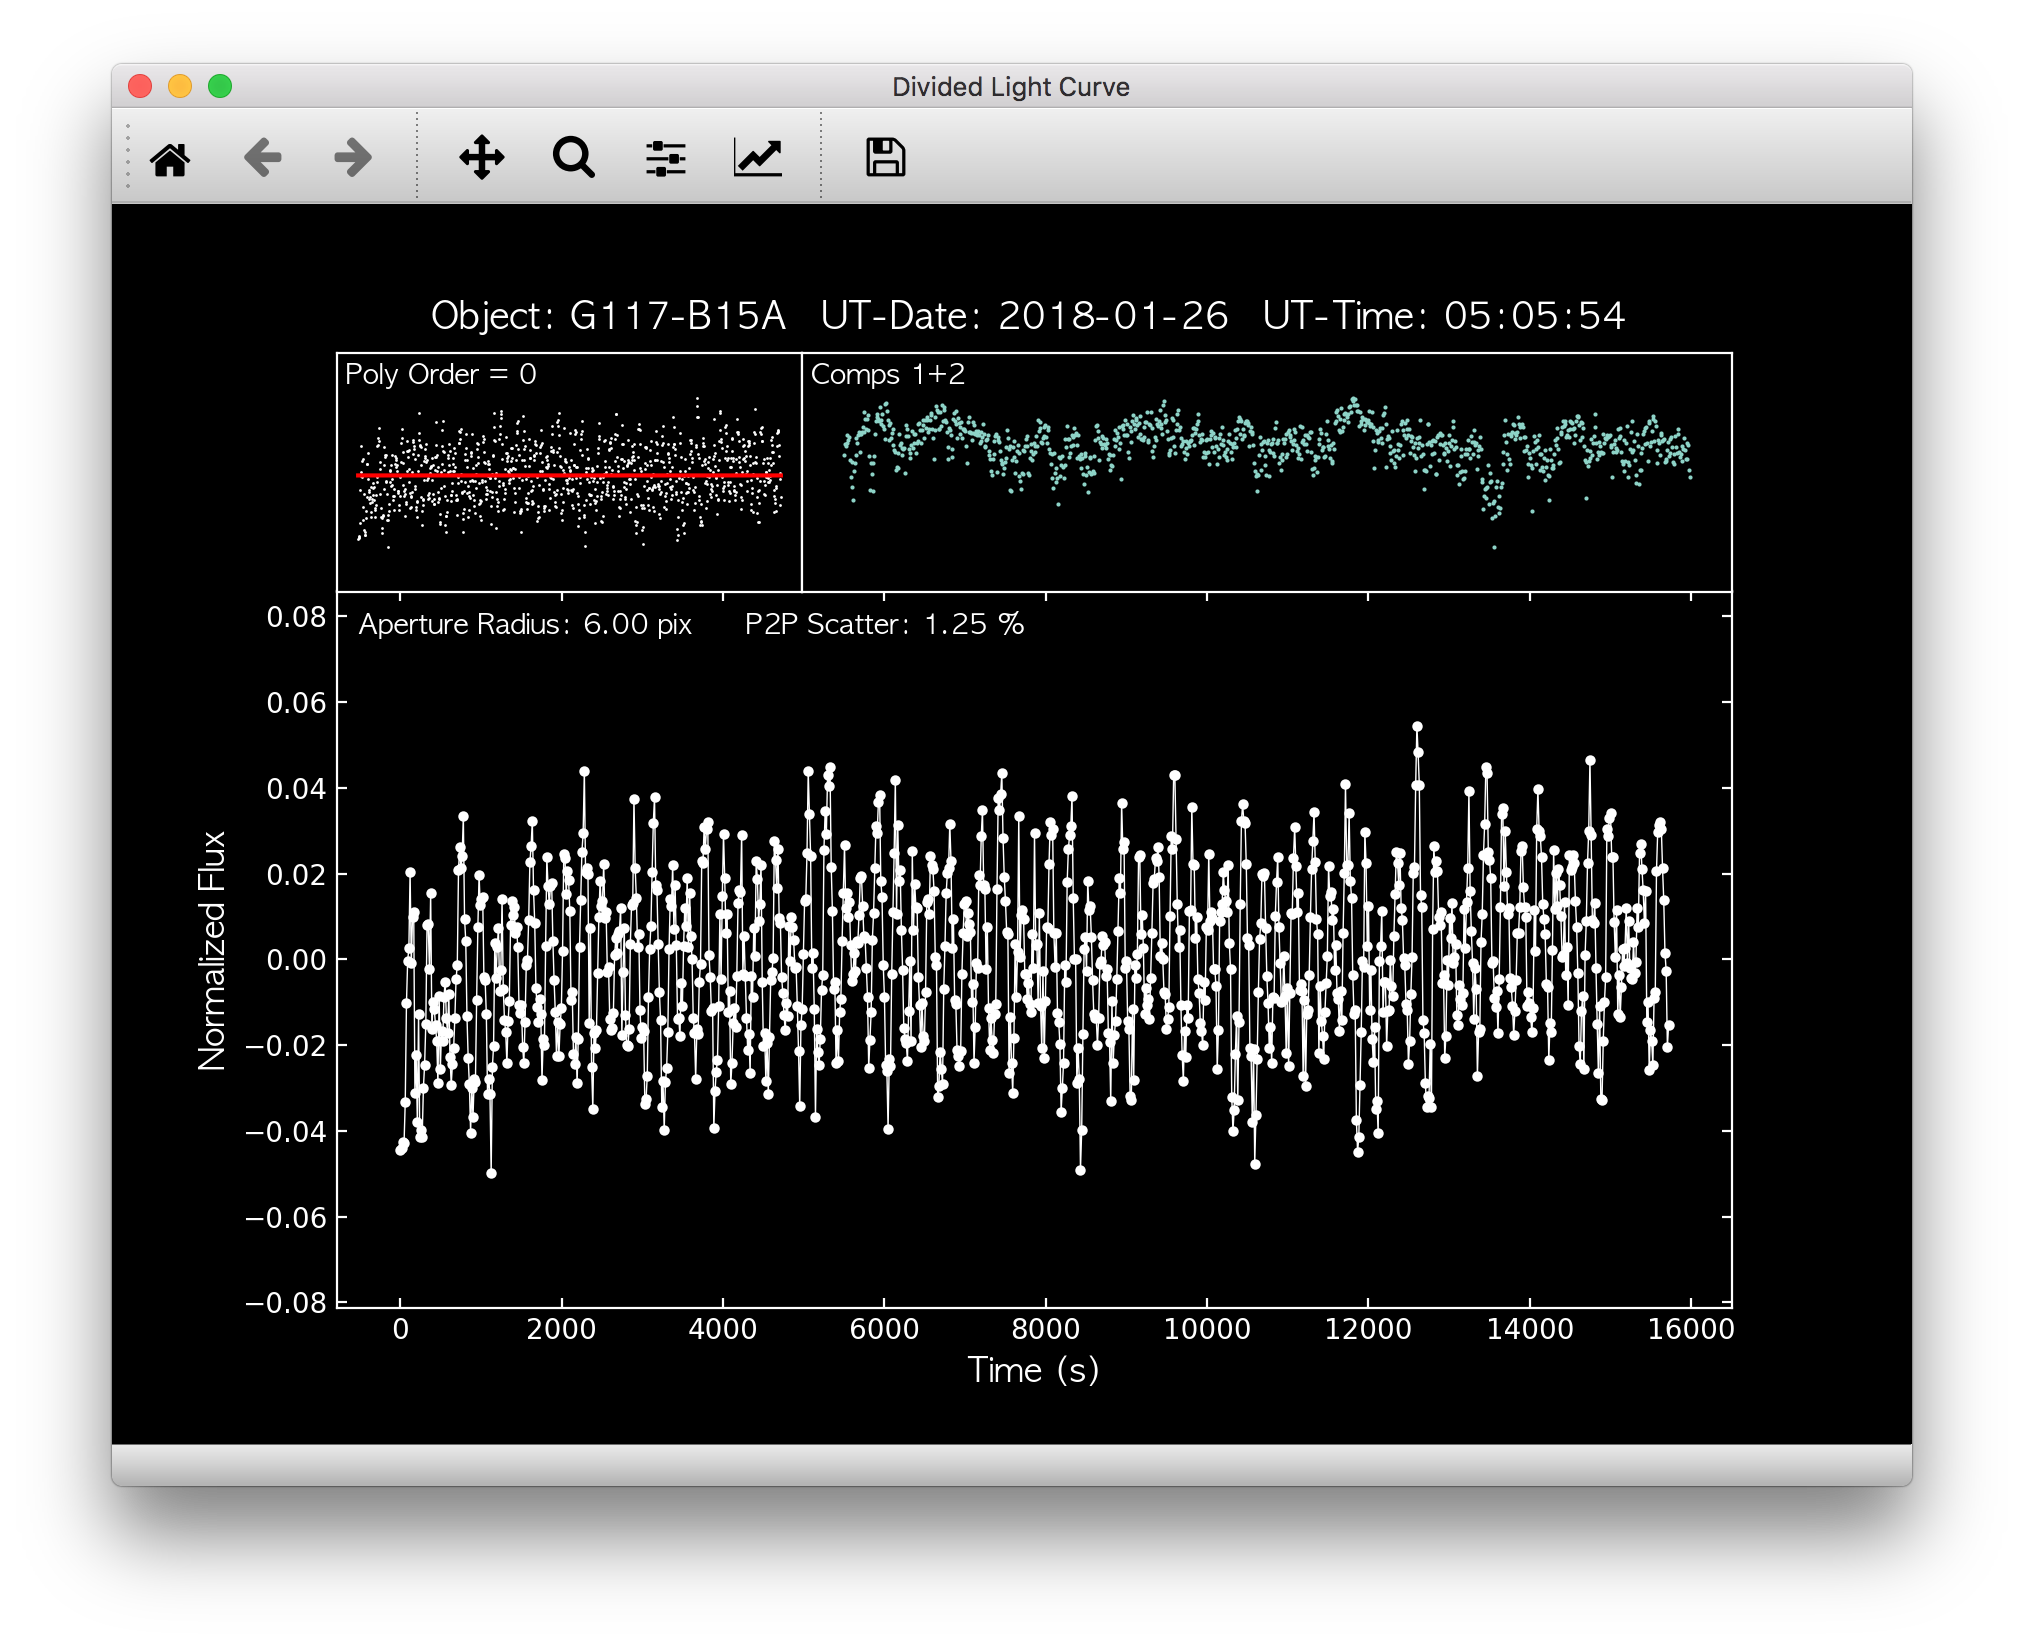
Divided Light Curve: Primarily displays the divided light curve, but also displays the summed comparison star flux (top right panel) and the polynomial being used to de-trend the light curve (top left panel). This is where most of the interactive tools are used.
Command Options
Similar to WQED, commands in phot2lc are executed via keyboard inputs. After startup and once you have clicked within one of the windows, you can print out a full list of command options in your terminal by pressing “?”. The output will look like the following:
COMMAND LIST - Divided Light Curve:
  - Type '?' to re-print this list of commands.
  - Type 'd' to delete the point nearest the cursor.
  - Type 'a' to add back a deleted point.
  - Type 'A' to add back ALL deleted points.
  - Type 'g' to activate/deactivate garbage rectangle.
  - Type 'r' to activate/deactivate reverse garbage rectangle.
  - Type 'z' to activate/deactivate zoom rectangle.
  - Type 'Z' to restore zoom to original.
  - Type 'x' to perform sigma clipping.
  - Type 's' to toggle the display of deleted points.
  - Type 'f' to perform a polynomial fit, WITHOUT sigma rejections.
  - Type 'F' to perform a polynomial fit, WITH sigma rejections."
  - Type 'c' to choose comparison stars for division.
  - Type 'v' to move to previous aperture size.
  - Type 'w' to move to next aperture size.
  - Type 'Q' to close plots and exit the program.
  - Type 'W' to close plots and continue without grid search.
  - Type 'G' to close plots and continue with grid search.

COMMAND LIST - Aperture Selection:
  - Type '?' to re-print this list of commands.
  - Type 'd' to delete the point nearest the cursor.
  - Type 'A' to add back all deleted points.
  - Type 'Q' to close plots and exit the program.
  - Type 'W' to save lightcurve with *USER* Selection.
  - Type 'G' to save lightcurve with *GRID* Selection.
The “Divided Light Curve” command list provides your options when you are working within the Divided Light Curve window. Within the First Image and Raw Photometry windows, the only commands available are “?”, “Q”, “W”, and “G”. The other command list for aperture selection is for the next window that appears if you decide to continue light curve extraction by typing the “W” or “G” keys when working in the Divided Light Curve window.
Aperture Selection
phot2lc selects the optimal aperture size by identifying the light curve with the lowest average point-to-point (P2P) scatter. The average P2P scatter is defined as:
The \(\langle\mathrm{P2P}\rangle\) is determined for all light curves using the same settings defined in the Divided Light Curve window (i.e. same deleted points, same polynomial division, same comparison stars used). Currently, this selection is automated and phot2lc does not allow manual selection of a different aperture size. A future version of phot2lc will likely provide this capability.
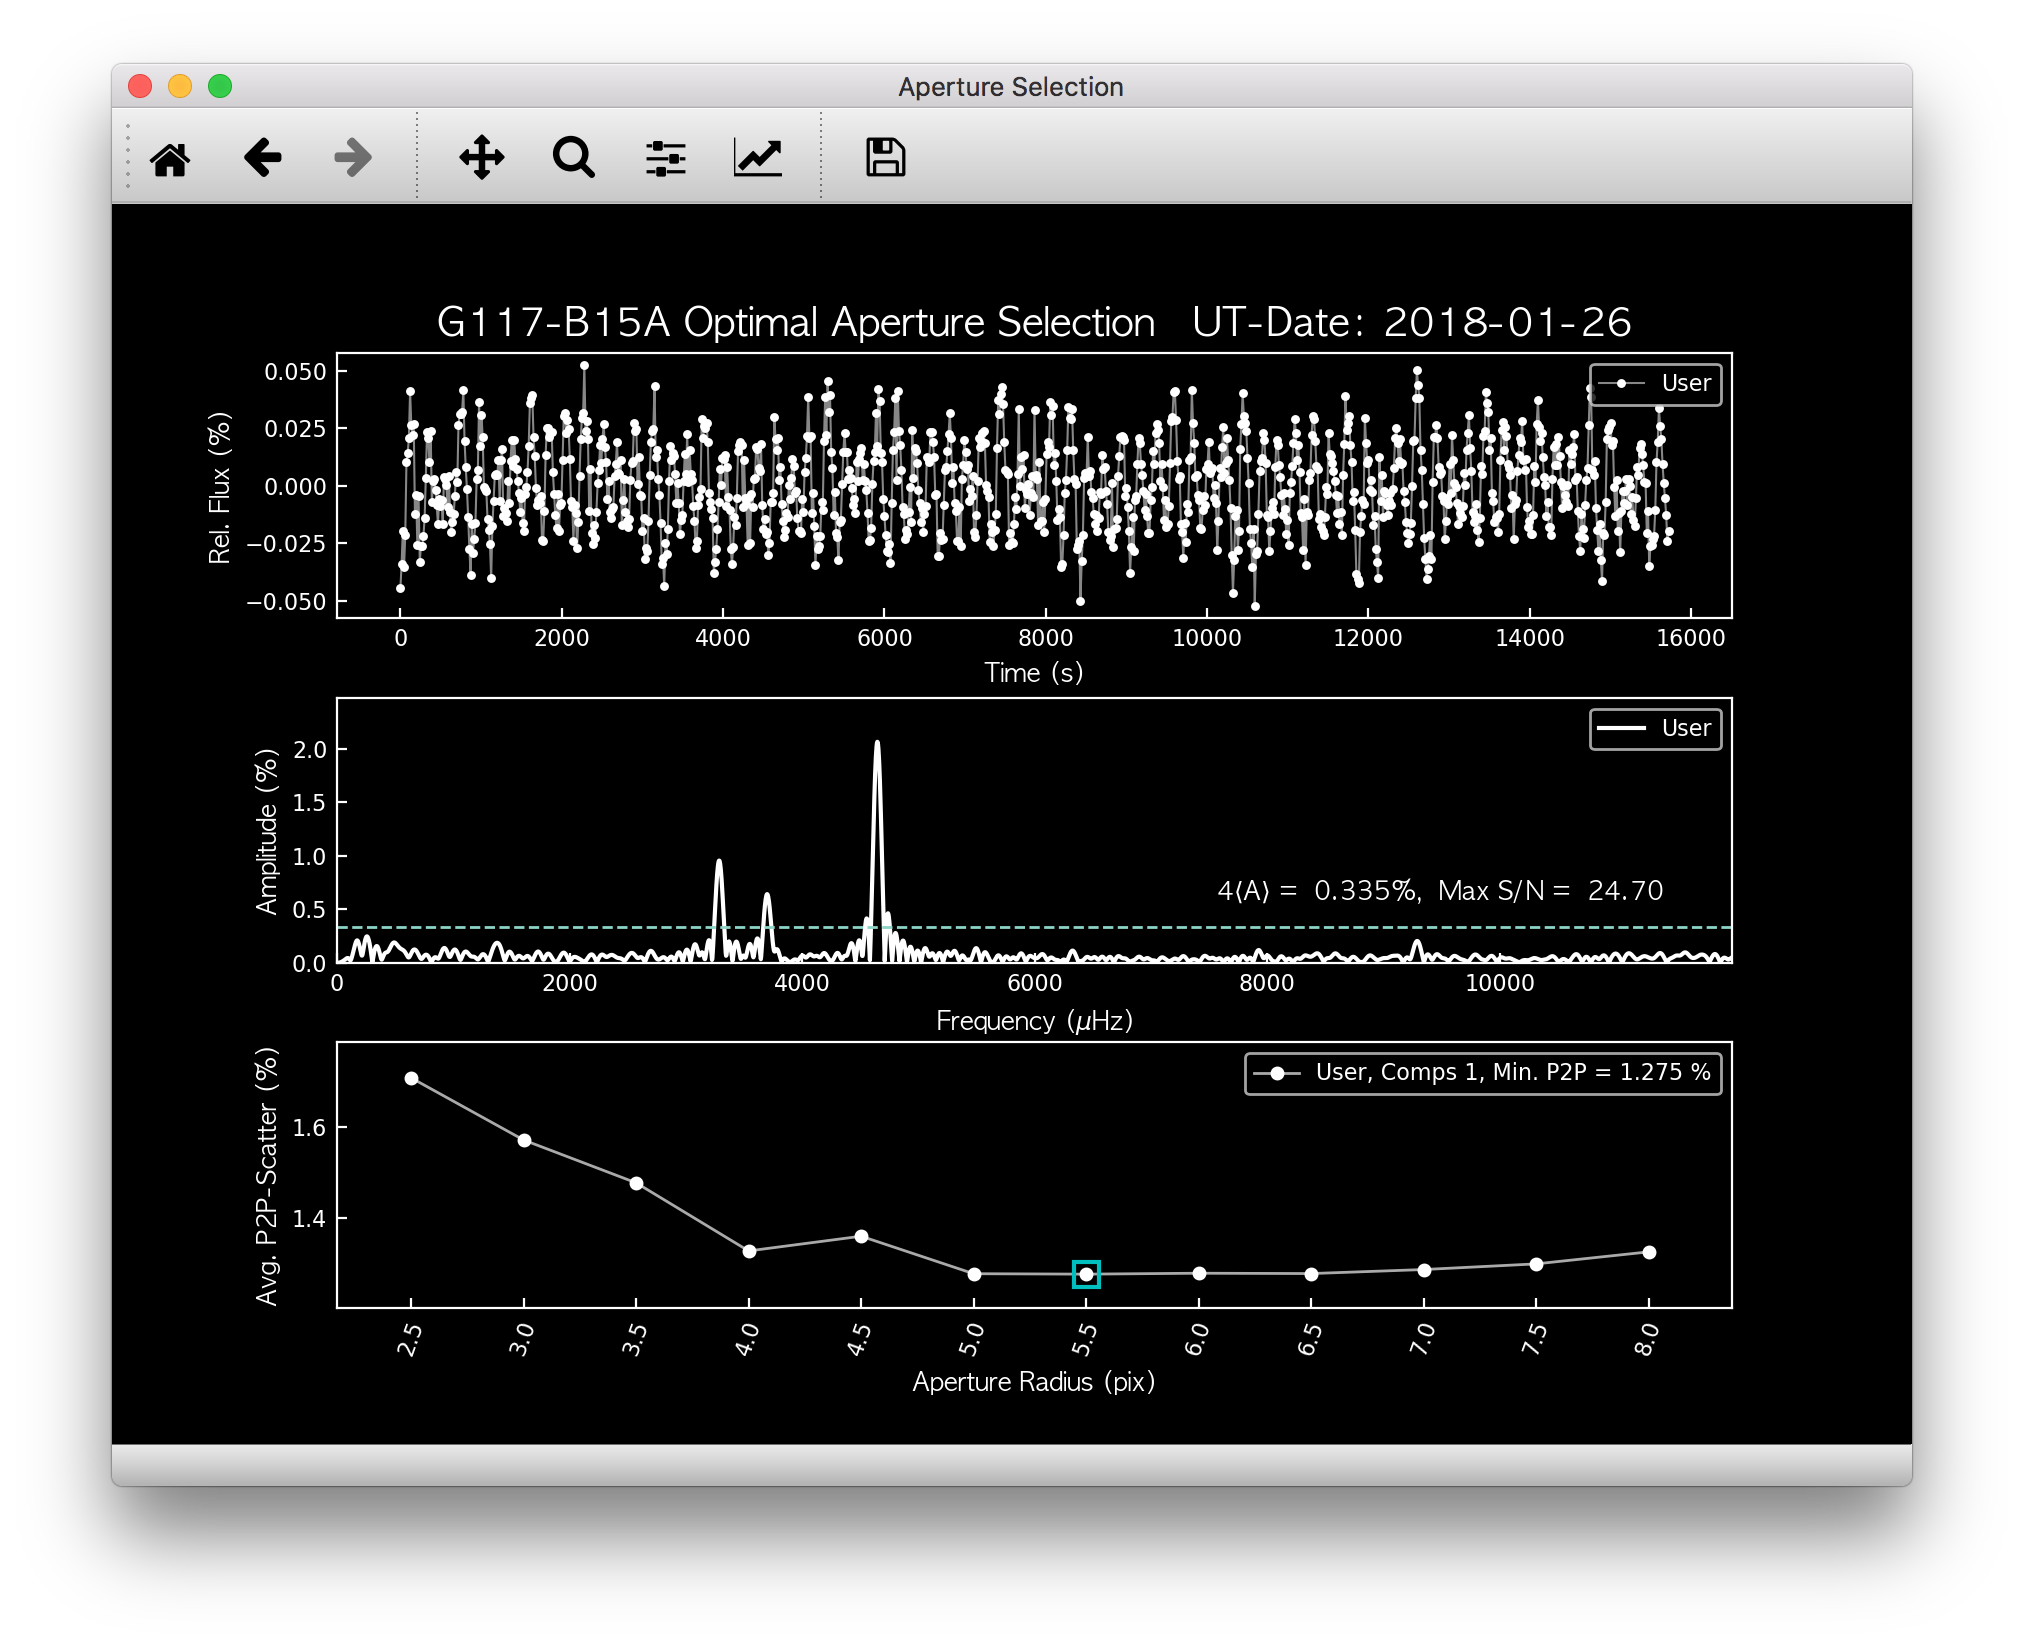
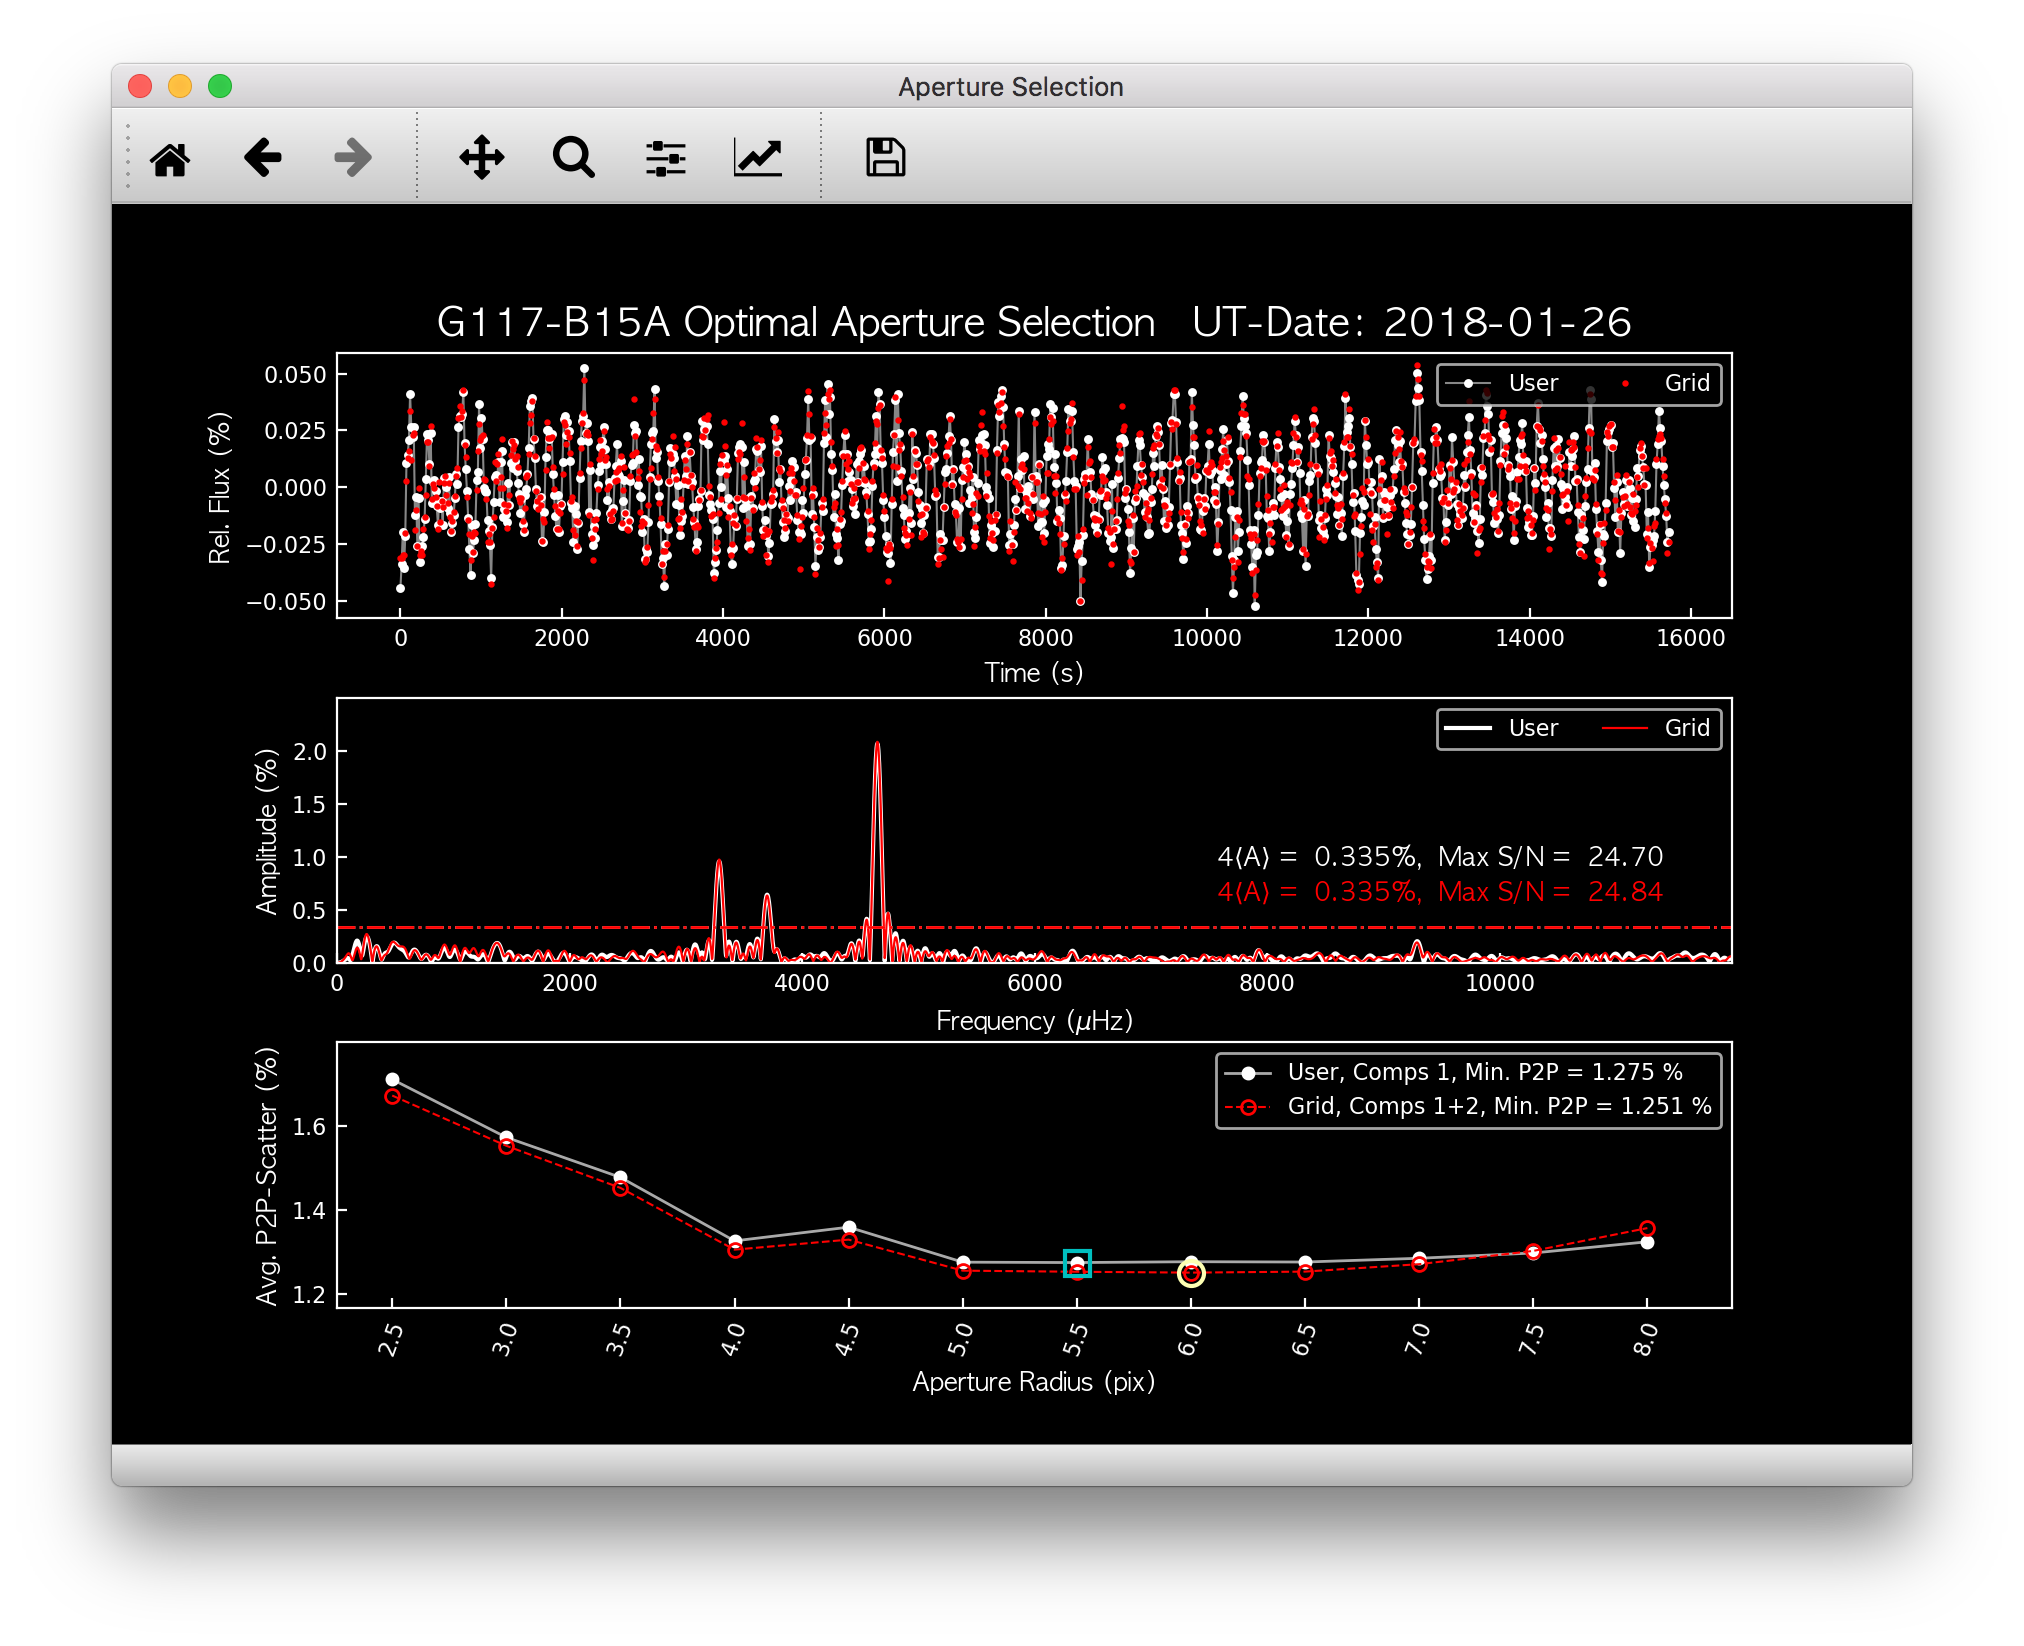
After pressing the “W” or “G” key from any of the previous windows (i.e. Divided Light Curve, Raw Photometry, or First Image), these windows will be closed and a new window will appear named Aperture Selection. This window displays the optimal light curve along with its periodogram, and a plot of \(\langle\mathrm{P2P}\rangle\) versus aperture size for all light curves.
If you chose the “W” option to continue, only one light curve, periodogram, and \(\langle\mathrm{P2P}\rangle\) curve will be shown (left image below). If you chose the “G” key, however, a grid search will have been performed considering all possible comparison star and aperture size combinations. In this case, two light curves, periodograms, and \(\langle\mathrm{P2P}\rangle\) curves will be shown (right image below). One set (colored white) corresponds to the standard optimization procedure performed with the User-selected comparison stars, the same as if you had pressed “W”. The second set (colored red), corresponds to the optimal comparison star combination found by the grid search.
If you did not perform a grid search, you can now save the optimal light curve by again pressing “W”. If you did perform a grid search, you have the option save either the optimal user-selected light curve with “W” or the optimal grid-search-selected light curve with “G”.
Output Files
Upon choosing to save your light curve with “W” or “G”, phot2lc will perform the barycentric time corrections to each point and then provide you with three output files. The .lc file contains the divided light curve while the .phot file contains the raw photometry corresponding to the optimal aperture size. These files are modeled very closely after the .lc1 and .wq files generated by WQED. The third output file is called, phot2lc_log.txt, and stores information about your saved light curve which allows phot2lc to essentially restore your session for a particular object (more details below).
The .lc and .phot files start with two time columns, the first corresponding to the original times and the second corresponding to the barycentric corrected times. Both are provided in the event that you consider the barycentric corrections for your particular object to be unreliable for any reason.
The naming convention for the files are <object>_<obs_date>.lc and <object>_<obs_date>.phot, where <object> is replaced by the object name and <obs_date> is replaced by the observation date in YYYYMMDD format.
The .lc File
The .lc file consists of a header followed by three columns of data. The header provides information with regards to both the observations and the light curve extraction. The three columns are (1) the mid-exposure times in seconds relative to the first exposure, (2) the relative flux values, and (3) the error on the relative flux. Below is an example .lc1 file showing the header and the first and last three rows of data:
# Object     = WDJ1944+4557                  # Name of Object
# RA         = 19 44 31.92                   # Object Right Ascension
# Dec        = +45 57 53.13                  # Object Declination
# Telescope  = McDonald 2.1m                 # Name of Telescope
# Instrument = ProEM                         # Name of Instrument
# TeleCode   = mcd2                          # Teledat Code Name
# Observer   = MLK                           # Name of Observer
# Date       = 2023-09-22                    # Mid-Exposure UTC Date at T0
# Time       = 01:43:44.000                  # Mid-Exposure UTC Time at T0
# MJD        = 60209.072037037               # Mid-Exposure UTC MJD at T0
# Exptime    = 15.000000                     # Exposure Time (s)
# Filter     = BG40                          # Filter Name
# BJED       = 2460209.574646168             # Mid Exposure BJD-TDB at T0
# Barycorr   = True                          # Barycentric Corrections Applied?
# ApPhot     = hipercam                      # Photometry Program
# OrigFile   = output.log                    # Source Photometry Filename
# ApRadius   = -1.00                         # Aperture Radius (pixels)
# AvgScatter = 4.44                          # Avg. Point-to-Point Scatter (%)
# NComps     = 6                             # Number of Comparison stars used
# CompIDs    = 1,2,3,4,5,6                   # IDs of Comparison stars used
# PolyOrder  = 1                             # Degree of Polynomial Division
# Nkeep      = 676                           # Number of points in light curve
# Ndelete    = 6                             # Number of points removed
# Author     = zvanderbosch                  # Author of this light curve
# CreatedOn  = 2025-02-26 22:38:03.807       # Date created
# Columns: Time since T0 (s), Relative Flux, Relative Flux Error
       0.000   0.016758   0.029044
      15.000   0.057503   0.029744
      29.999   0.013757   0.028536
       ...        ...        ...
   10244.711   0.036098   0.066617
   10259.711   0.013456   0.071603
   10274.710  -0.124630   0.201708
The .phot File
The .phot file also starts with a header providing some of the same information as the .lc file, and is then followed by several columns of data. The first column is the same as for the .lc file, providing the mid-exposure times with respect to the first exposure.
The remaining columns provide the sky-subtracted photometric counts for the target followed by each comparison star. The last column is always the sky column and represents the amount of background counts subtracted from the target’s aperture. Sky counts are not provided for the comparison stars. The number of comparison star columns will reflect the original number of comparison stars loaded in the ccd_hsp or MAESTRO photometry files, even if they don’t all get used to generate the divided light curve. However, if specific points were deleted from the divided light curve, they will also be removed from this file.
Below is an example .phot file, again showing the header followed by the first and last three rows of data:
# Object     = WDJ1944+4557                  # Name of Object
# RA         = 19 44 31.92                   # Object Right Ascension
# Dec        = +45 57 53.13                  # Object Declination
# Telescope  = McDonald 2.1m                 # Name of Telescope
# Instrument = ProEM                         # Name of Instrument
# TeleCode   = mcd2                          # Teledat Code Name
# Observer   = MLK                           # Name of Observer
# Date       = 2023-09-22                    # Mid-Exposure UTC Date at T0
# Time       = 01:43:44.000                  # Mid-Exposure UTC Time at T0
# MJD        = 60209.072037037               # Mid-Exposure UTC MJD at T0
# Exptime    = 15.000000                     # Exposure Time (s)
# Filter     = BG40                          # Filter Name
# BJED       = 2460209.574646168             # Mid Exposure BJD-TDB at T0
# Barycorr   = True                          # Barycentric Corrections Applied?
# ApPhot     = hipercam                      # Photometry Program
# OrigFile   = output.log                    # Source Photometry Filename
# ApRadius   = -1.00                         # Aperture Radius (pixels)
# Nkeep      = 676                           # Number of points in light curve
# Ndelete    = 6                             # Number of points removed
# Columns: Time since T0 (s), Target, Comparisons, Sky
       0.000       3457    29034    42996    25397    43921     6648     7415   405258
      15.000       3640    29160    43144    25986    44821     6575     7652   381606
      29.999       3437    29067    42429    25528    44015     6644     7267   370744
       ...          ...      ...      ...      ...      ...      ...      ...      ...
   10244.711       1922    15753    24038    14141    24874     3581     4083   645313
   10259.711       1938    16427    24674    14755    25188     3820     4245   554616
   10274.710        533     5160     8030     4692     7983     1207     1318   550579
The phot2lc_log File
The phot2lc_log.txt file saves information about the light curve extraction so that if you want to rerun phot2lc for an object, it will automatically apply the same changes that you had already made. This file is only generated if you have previously saved a light curve and includes information about which points had been deleted, what polynomial was used for detrending, and which comparison stars had been used for division. This can save large amounts of time for users when small modifications need to be made after the original light curve extraction.
In addition, this file stores each data point’s raw timestamp, prior to barycentric corrections, so that the timing information is preserved. This is useful if phot2lc originally generated timestamps via the header keywords within a list of FITS files, but you would like to remove most of the FITS files post-extraction to save computer space. If a phot2lc_log file is present, phot2lc will preferentially use it to generate the time stamps upon execution.
An example phot2lc_log file is shown below, which shows the header and the first and last three rows of data. The first data column provides the raw mid-exposure times relative to the first exposure, and the second column is just a boolean value where 0 = Deleted and 1 = Kept.
#     OBJECT = WDJ1944+4557
# POLYNOMIAL = 1,5,2.00,100.00
#      DTMID = 2023-09-22T01:43:44.000
#      COMPS = 1+2+3+4+5+6
#       TEXP = 15.000000
     0.000  1
    15.000  1
    30.000  1
     ...   ...
 10260.000  1
 10275.000  1
 10290.000  0